Table of Content
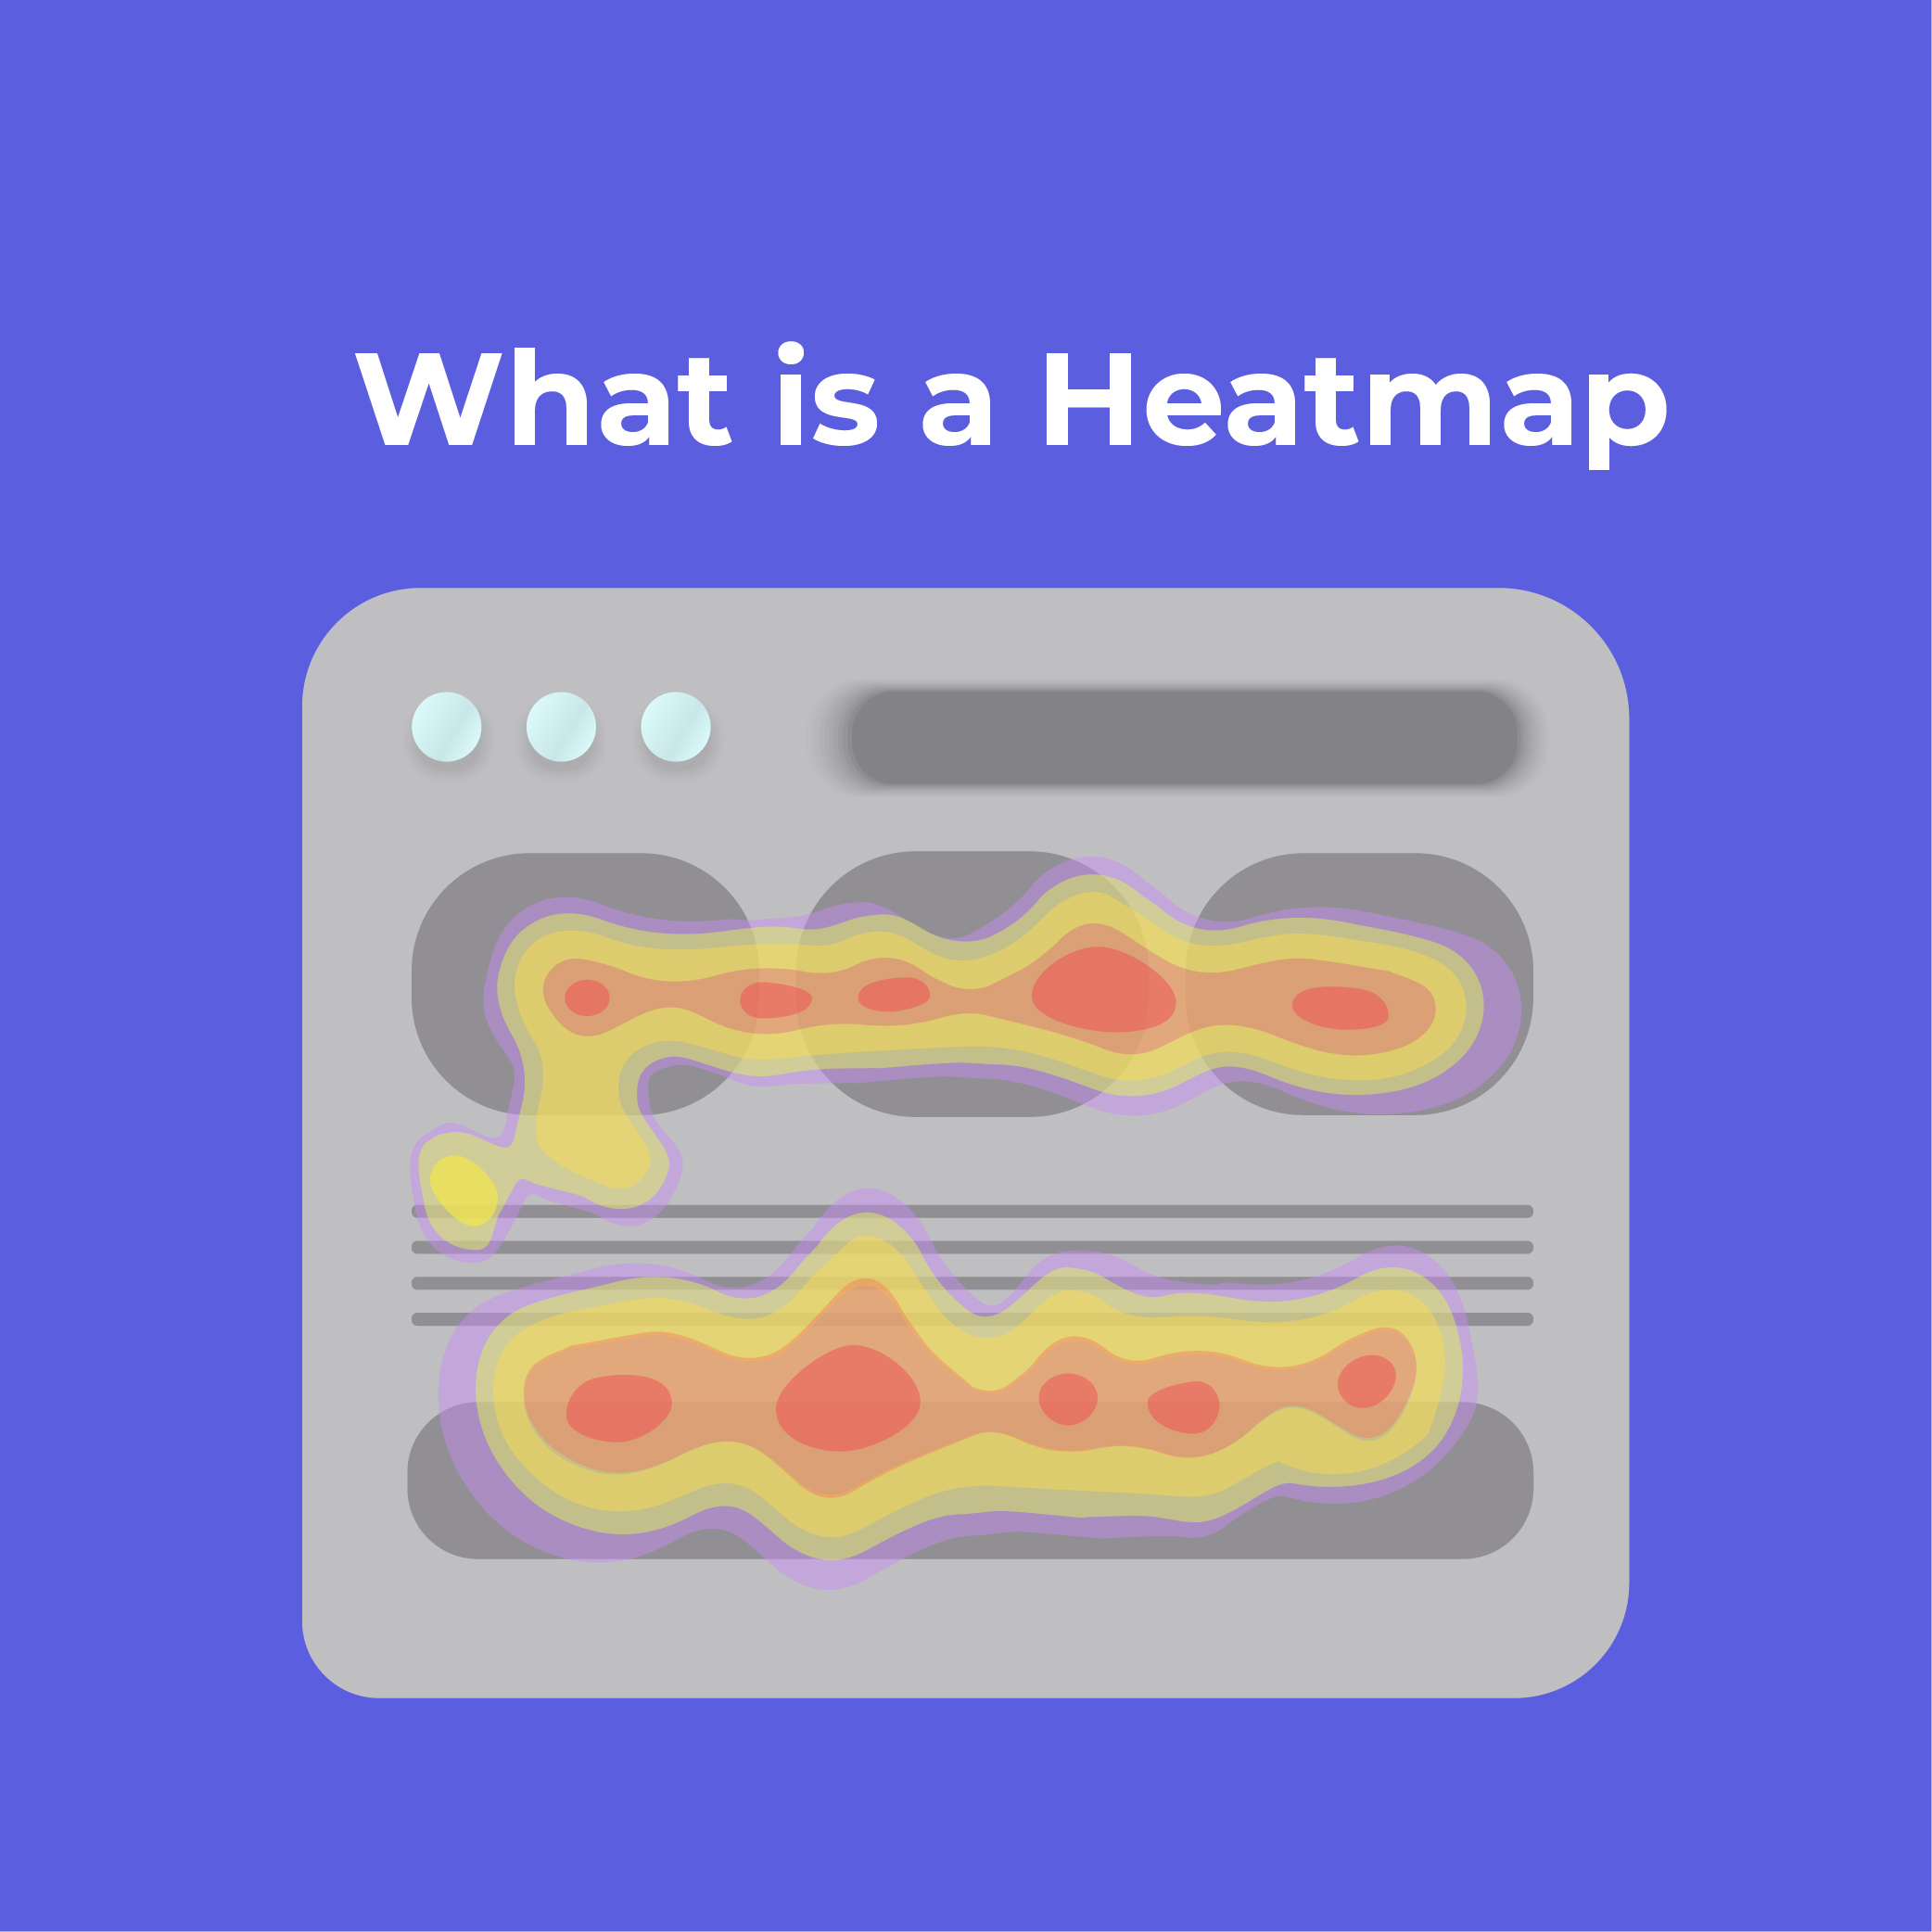
People use different methods to understand how the data on their websites are being used. But to check the said data representation numerous actions are taken wasting the time of people which can be utilized in a different way. What Is a heatmap? A data visualization technique for geographical representation that presents data in a system color coding to show different values.
Heatmap has been around since 1800 but in the financial market, it was introduced in 1990. It was created as a tool to geographically display financial market information in real-time. Colored schemed is very much preferred by people since it gives more shade of color making it easy for people to understand.
The darker the colors like orange and red show the more popular or used section. In contrast, blue and purple colors show less used and less popular sections. Each heatmap works differently. Click map uses different shades of one color. The darker the color the more clicks are on the area.
What does it Show?
It shows the reaction of a user on the page in the form of visual representation. This helps a company gather the analysis of the data at a faster rate so they can understand what products are being greatly utilized in the general area. Companies use the data gathered through the heatmap to optimize their website because they know what product is preferred by others.
It shows the behavior of the customers. Companies study the behavior of the user and change the outlook of the website to mostly show the products that the users are focusing on. If people are not tapping on the important elements of the website, then the company should definitely change its design of it.
How does it work?
Heatmaps creation depends on the type. Specifically, it is categorized into two types:
- Interaction heatmap which measures the activity of the user on the website. The number of clicks, movement of the scroll, mouse, and many more.
- Attention heatmap is very complex. It monitors the movement of the user’s eye to determine the content liked by the user.
Types of Heatmaps
There are many heatmaps that can be used to study the behavior of the customers. The heatmaps to understand the behavior of the customers needs to be paired with other data points. Google Analytics, UX surveys, and many more product analytic tools are used for such purposes. The following three are the most common types used by many companies.
Click Maps
This is a popular heatmap because it shows where customers gather on the website. It helps the company analyze how the customers are using their services. This is beneficial for the company because they can understand if there is any problem with their website. By determining which elements of the website are least clicked they can optimize it to get better results.
Through this, a company can also gain an advantage in the ROI area. Knowing which element is preferred by the customers they can greatly invest in it to obtain greater returns. Although sometimes the result can be an error as well since people in irritation or in frustration will continuously click on different parts of the pages. The chances of such action are very low.
Scroll Maps
Similar to a click map, a scroll map also shows the behavior of the customers. This studies how much down a customer scrolls to study the product of the website. How many scrolls the page but stop at midway. How many visitors abandoned the page? The percentage of people and up to where they have scrolled.
A company can change the look and length of the webpage by knowing how much people scroll. This way the companies will not have much problem deciding how much and what type of content should be displayed on the screen. The owners can also identify the false page attached to the website and take action to get rid of it.
This heatmap helps in knowing whether the important content is being studied or not. A company has to make sure to know whether the data is from a desktop, laptop, or mobile phone.
Mouse Tracking Maps
It is not studying the clicks performed by the mouse but the movement of the mouse itself. This can identify whether a person is thrash-clicking, moving the mouse in irritation, hovering, or hesitating in performing some action. It studies the behavior by analyzing both the eye movement of the user and the movement of the mouse.
Times to Use Heatmap
As long as someone knows about the heatmaps they can utilize them to make the website gain more popularity. The use of a heatmap allows the company to fully understand the working of the website.
Website Redesign
Using a heatmap to understand the shortcoming of the previous design can help the company to design a site that will focus on the important parts. Make full use of it since you are spending your time, effort, and money to create a website design that will generate greater results from the users.
Analyze all the function of the old website to decide which portion of the website need more attention. The services provided to the customers are responsible for generating more traffic to the website. The better the service the more popularity your company gains increasing the sales of the company.
Adjusting the most frequently used tabs on the front page, and checking your call-to-action button to determine where it should be attached.
Testing the Elements
You can check the elements of the website by heatmap. This helps the company understand how a customer interacts with the content of the material.
Advertisements
When running an ad or PPC heatmap can help you greatly. You can understand which ad of yours is getting more engagement. Compare it to other ads to determine how much traffic the ad of yours is generating.
Website Pages
An important part of any site is usability. Navigation through the site can affect the mind of a prospective client. Why buy from companies that cannot even properly maintain the website of the company. Making use of the heatmap allows the company to properly adjust the outlook of the website for customer use.
Content Marketing
Content about the product is extremely necessary. People need to understand what is the function of the product they are going to buy. Written content is used in the form of blogs and insight on the website. A company should regularly check which of the blogs are being used to adjust the content of other blogs similar to them.
When the company understands what type of content is more interactive for the customers, they can focus on creating new content to match the type. This way the customers will gain proper knowledge related to the product.
Population Map
Heatmap as stated can be used for many things. In this map, a company can determine the location where their website is mostly generating traffic. A literal will be colored to present the location where the sites were used from. The density of the color can explain the number of times the site was activated in the area.
Advantage of Heatmaps
- Helps in understanding a large quantity of data at a visual glance.
- Identify the area where users are ignoring the content. Take immediate action to deal with the problem by implementing solutions.
- Identify the patterns of the users. When a company understands the behavior of the user it can implement strategies that can increase the traffic to its site through popularity.
- Learn from the past to create more effectiveness in the future. You can change the look and pattern of the website to make it more user-friendly.
- Locate the area where users are naturally drawn and place important materials on the location.
Conclusion
Heatmap is an excellent tool for people in business sectors to increase the reputation of the company. Although used many people still ask what Is a heatmap? It is the tool for the success of many company websites.